Our user surveys provide insight into how users experience your physical or digital products. We map usability, functionality and design to identify bottlenecks and potential for improvement. The goal is to gain valuable user insights so that you can further develop your products to ensure increased usability and engagement.
Identify bottlenecks and improvement potential
What?
User surveys map how different user groups experience and evaluate physical or digital products. Such surveys provide valuable insight into how existing or potential users experience the interaction with your products.
At InFact, we offer tailor-made survey programs that are tailored to your insight needs. A user survey will typically measure important aspects such as usability, design, functionality and how the product meets users’ expectations and needs.
Why?
It is essential for developing products that meet user needs. By analyzing user feedback, we can help you identify challenges or areas for improvement. This way, your business gets an important insight base to further optimize the user experience. Based on real user insights, your business can adjust product development strategies, which in turn can help increase customer satisfaction and engagement.
Who?
At InFact, we offer user surveys aimed at different target groups. We conduct user surveys both based on your email lists (e.g. from member or customer registers), and by drawing samples from survey panels. Often the latter option will be particularly relevant if you want insight into user experiences in the general population, and not just among your most loyal customers.
The number of participants in such surveys will vary with regard to your insight needs. If you want representative surveys where the results can be generalized to the entire population – e.g. nationwide or in your municipality – as a rule of thumb, approximately 1000 participants will be sufficient.
How does it work
InFact offers a wide range of research methods for conducting user research. Which method you should choose depends on your insight needs. Our market analytics consultants are helpful in tailoring a methodological approach that suits your needs and preferences.
When it comes to choosing methodological tools, the most important distinction is between quantitative and qualitative methods. These can be used separately or in combination, so that you gain the most comprehensive insight into user experiences.
Quantitative methods
Such methods involve the collection of numerical data. Here, the goal is to analyze the relationship between variables using statistical techniques. By quantifying user experiences, these methods provide clear, numerical answers to how different factors influence such experiences.
At InFact, we offer custom Web Surveys (CAWI) to map user experiences.
Qualitative methods
Qualitative methods involve the collection of qualitative and non-numerical data that forms the basis for in-depth analyses of how different target groups perceive your brand. Such methods are particularly useful when you want to explore complex relationships and understand the underlying reasons why your brand is perceived the way it is.
At InFact, we offer the following main forms of qualitative methods for mapping brand strength:
- In-depth interviews
- Focus groups
- Mobile ethnography
- Overview studies
All data collection at InFact is carried out in accordance with the ICC/ESOMAR international code of conduct for the practice of market and opinion research. This means, among other things, that all processing of personal data is carried out in accordance with the GDPR.
What do I get?
At InFact, we also offer customization when it comes to report formats. The following report formats are popular among our customers:
Powerpoint report
Here, our analysis team with market analytics expertise will design a report that summarizes results, digs deeper into particularly interesting statistical relationships, and provides input on the way forward based on the insights from the brand research. The results are often presented in the form of graphs, tables, and statistical measures, accompanied by textual interpretations of this. Such PPT reports are particularly useful if you need to effectively communicate the results to others, either externally or internally in the company. We are also helpful in adapting the report to your visual templates if you wish.
Word/PDF
InFact also offers more comprehensive reports in MS Word or PDF format. Here we design longer written texts according to the desired layout. The results are typically presented in the form of graphs, tables and statistical measures, as well as longer textual interpretations and discussions of the results of the survey.
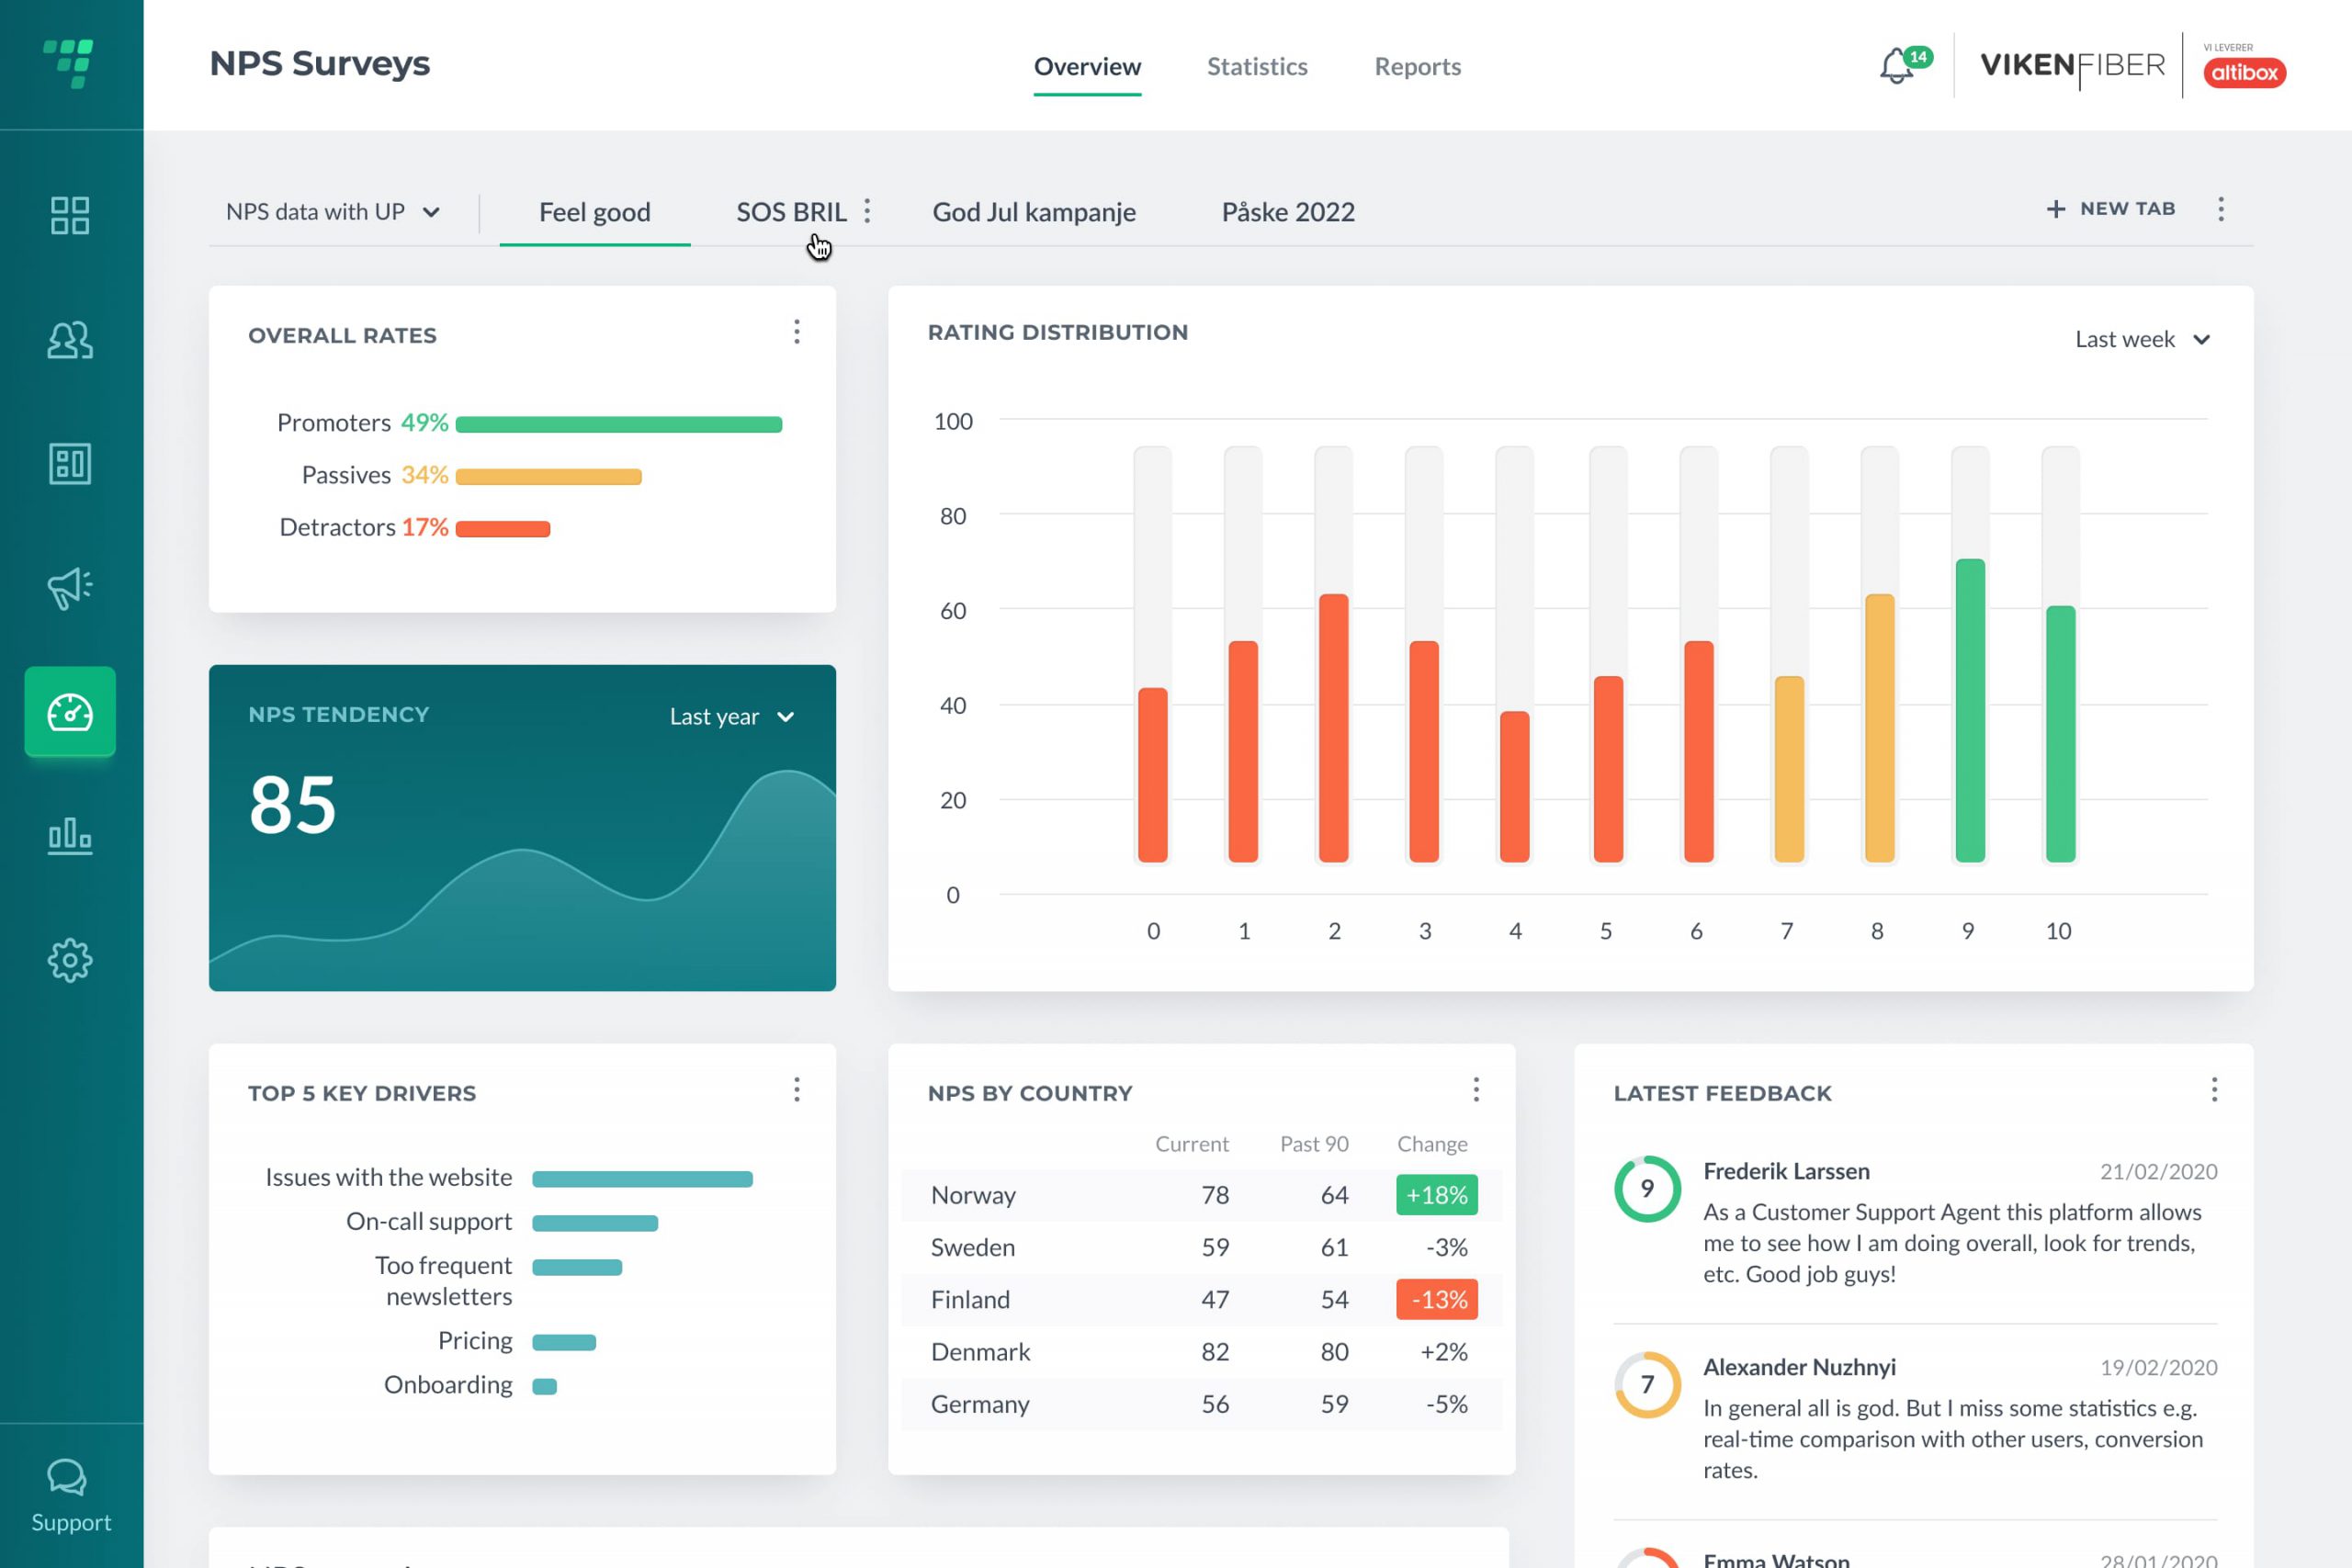
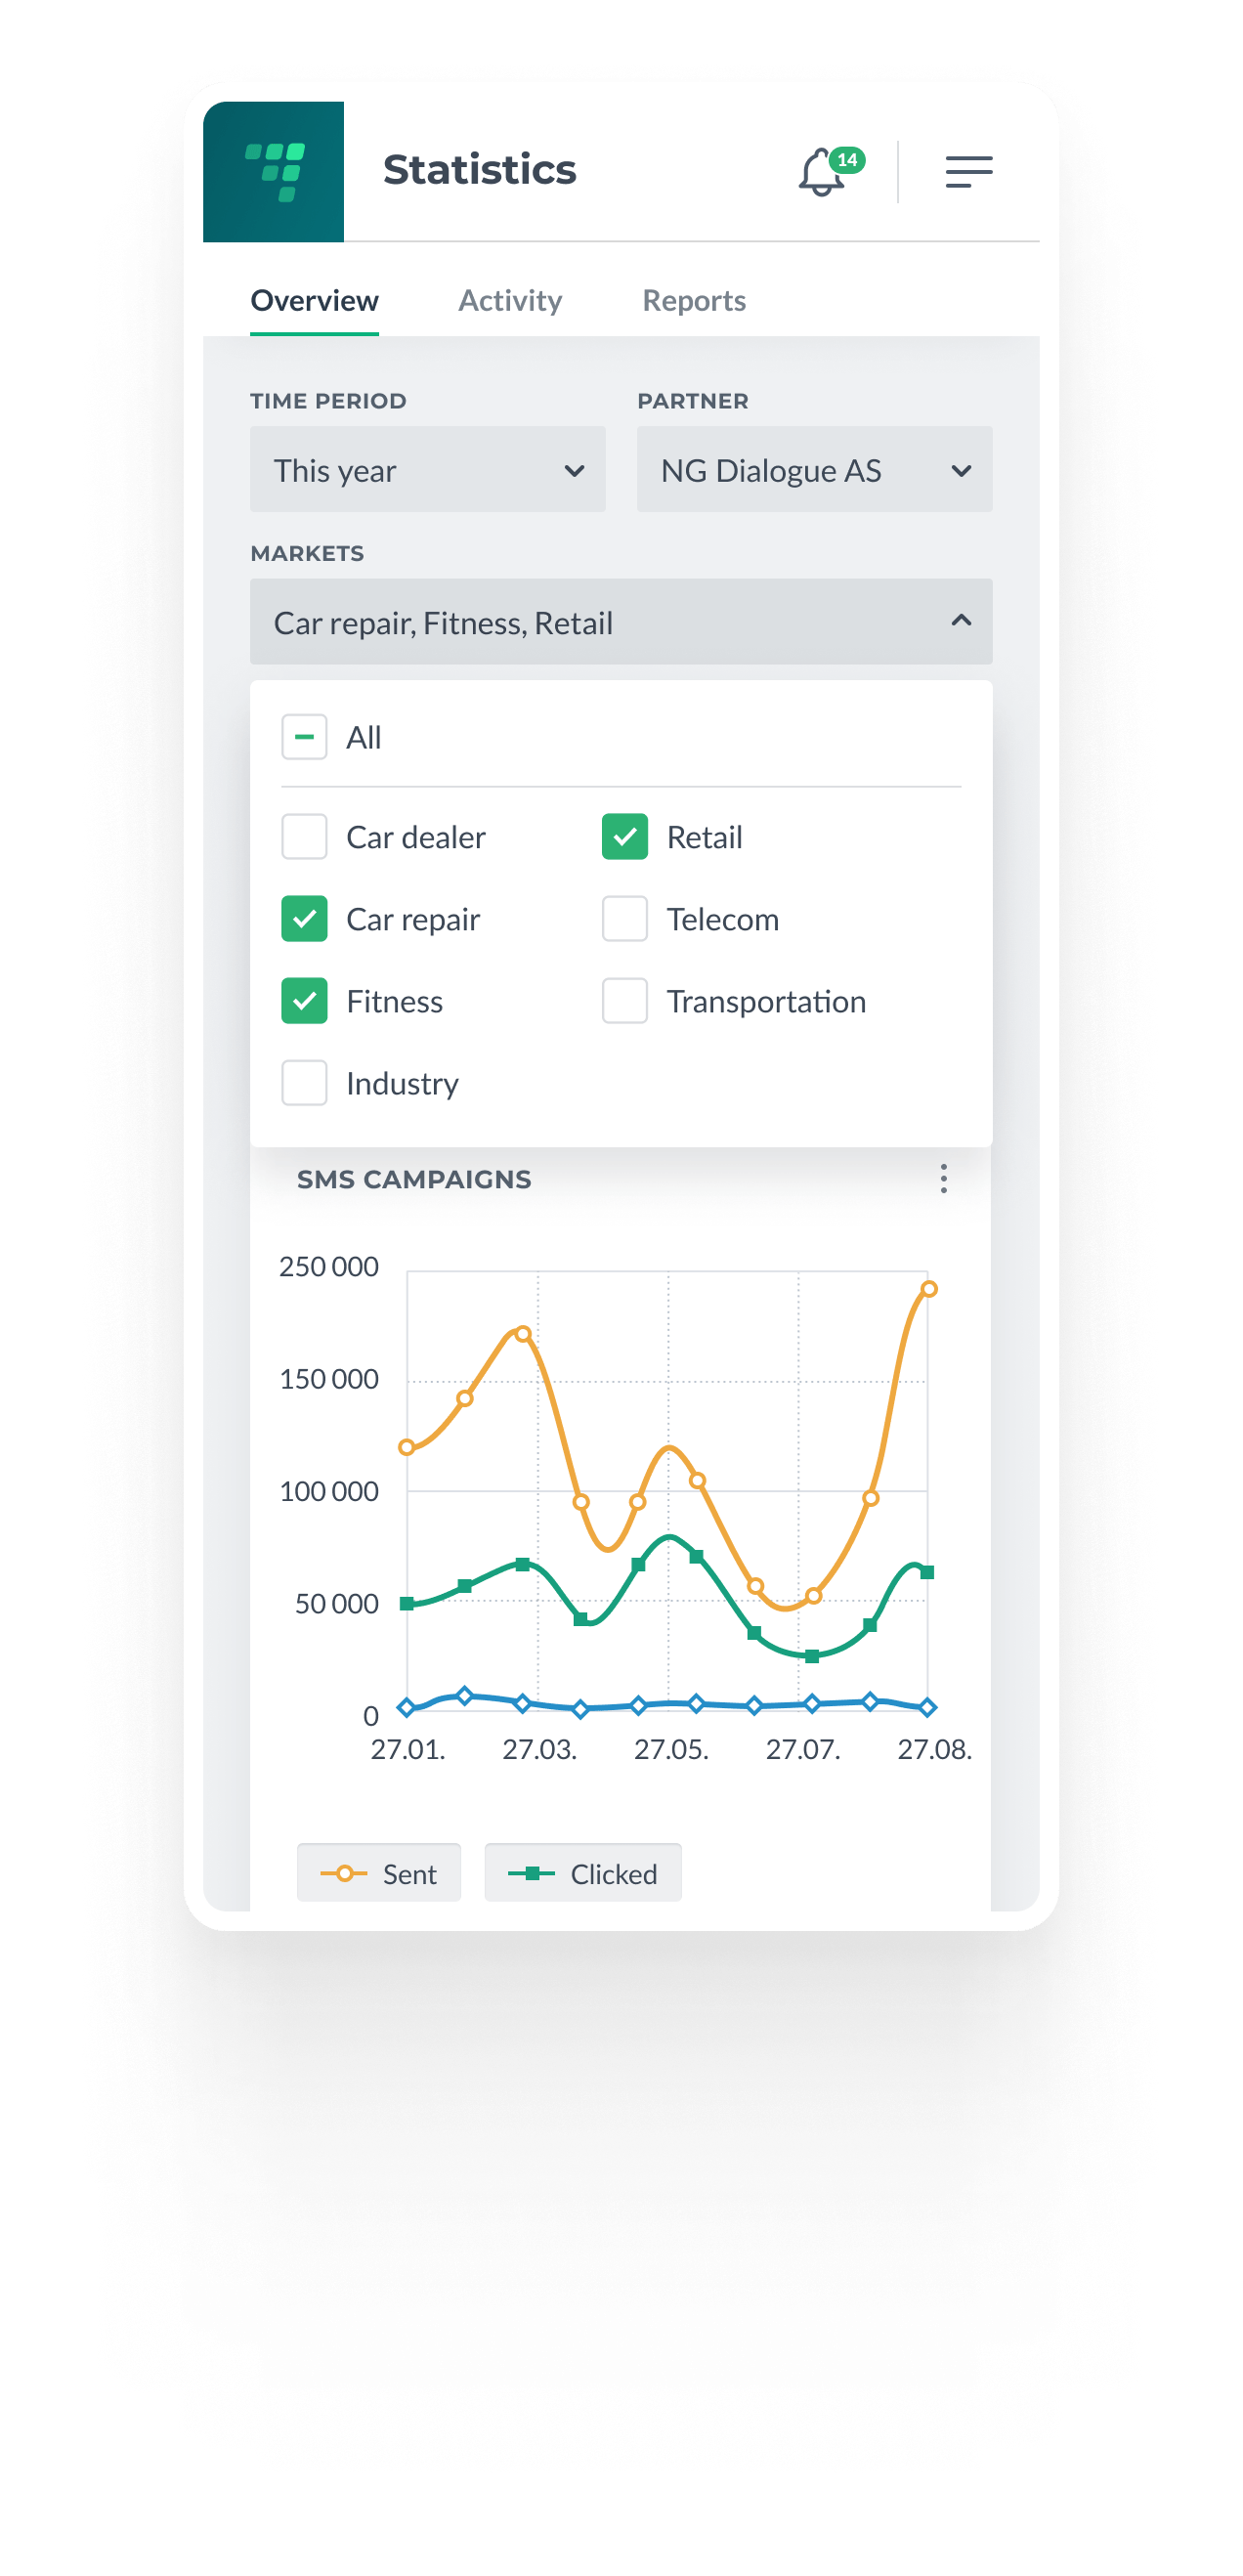
Dashboard
If your brand research is based on quantitative data collection – i.e. web or phone surveys – you can access an analytics dashboard on our InFact Survey platform, where you can explore the results of your brand research yourself. Here, complex data sets can be visualized and made available for easy interpretation. The dashboard provides an intuitive overview of your survey results, with user-friendly features designed for efficient data analysis.
Let's level up your business!
Please contact one of our employees for a non-binding conversation about surveys and insights at survey@infact.no.

